

Financial Report
Filters
To view more detailed consumption and cost information, you can use the following filters (clicking the funnel button (green box in the image) resets to the default state):
-
Time Range: Select a specific period for cost analysis (e.g., current week, last month, or a custom range)
-
Breakdown By: Option to choose how reports are categorized based on two main criteria:
- Service: View cost and consumption details based on service type, such as infrastructure, cloud storage, Kubchi, and other services
- Project: Review consumption and costs separately for different projects
-
Service Type: Select a specific service to focus on a particular type of consumption (e.g., only virtual machine or cloud storage services)
-
Resource Type: Depending on the selected service, you can filter related resources (e.g., floating IP, VM, disk volume, etc.)
-
Project: Display data broken down by projects defined in your account
Cost/Consumption Report
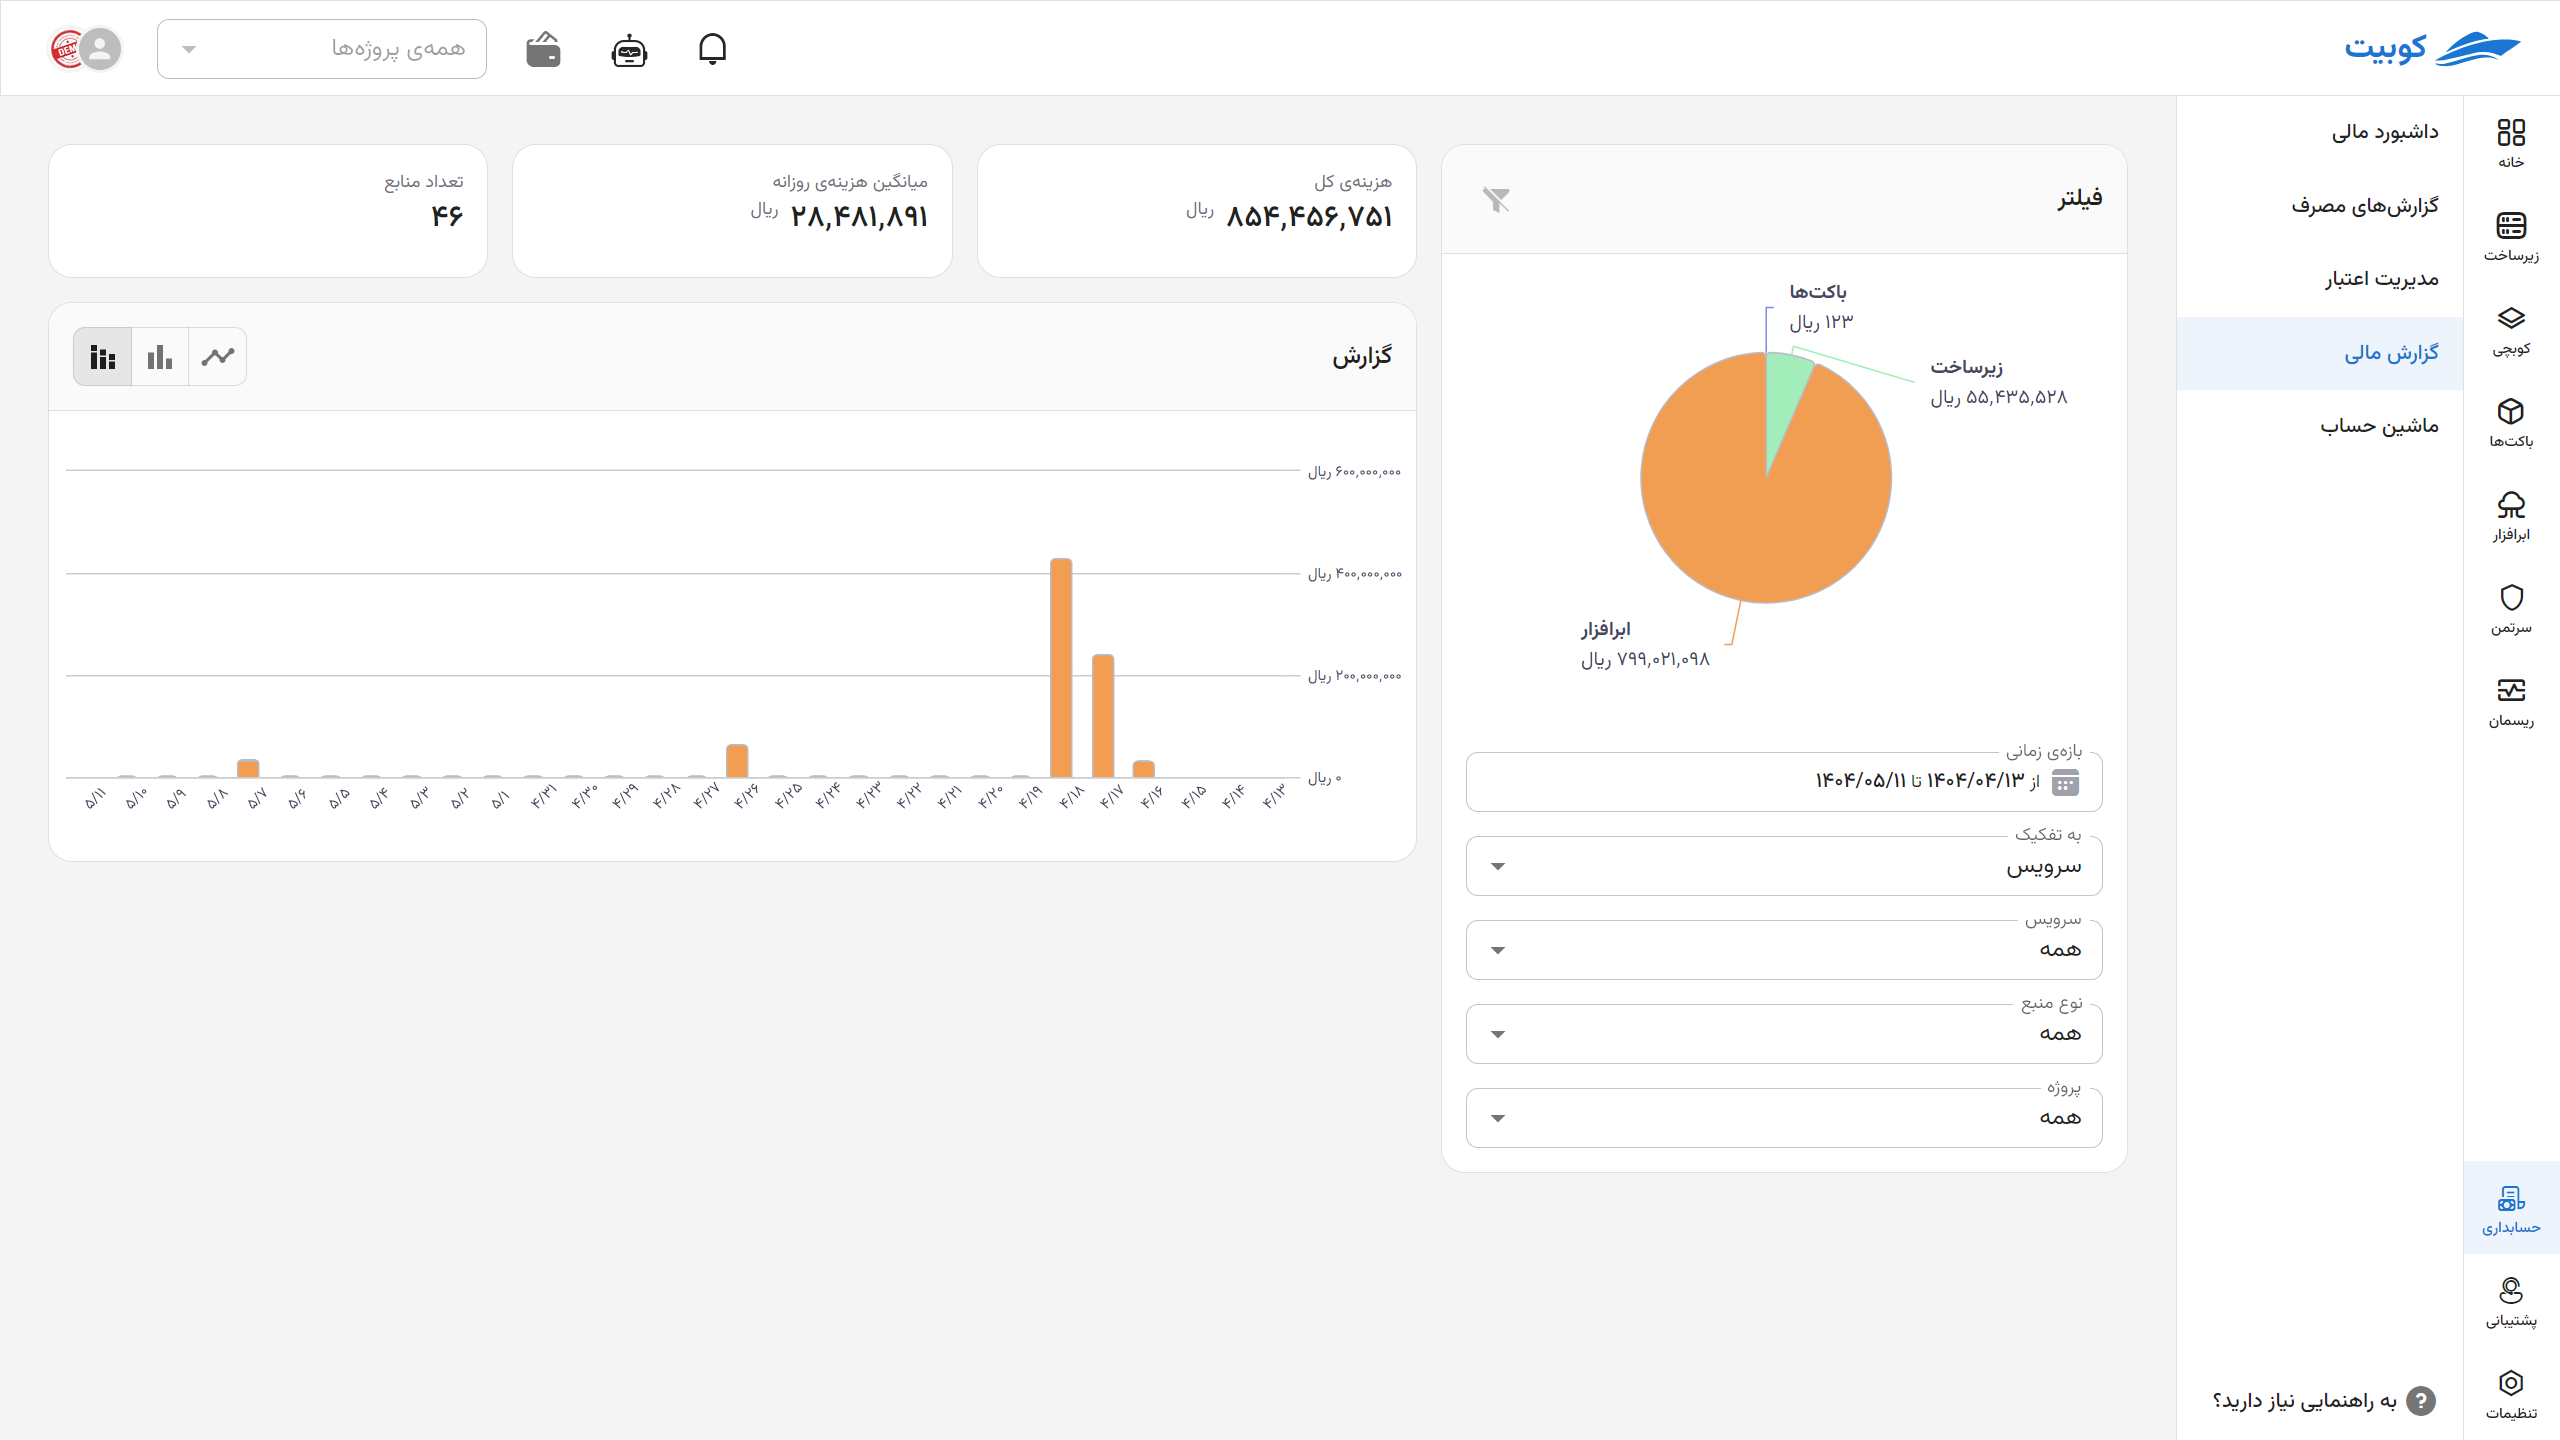
This section provides a summary of consumption and cost status based on the selected filters:
- Total Cost: Total costs within the filtered period and conditions
- Daily Average: Average daily resource consumption within the selected period
- Number of Resources:
Total number of resources in use during the specified period
Charts
Time-Based Chart
Visualization of consumption and cost trends over time with three display modes:
- Stacked Bar Chart by Breakdown:
Displays detailed consumption or costs based on selected filters, in daily, weekly, or monthly time intervals. - Aggregated Bar Chart:
Shows the total consumption or costs for each time interval, without breakdown by resources or services, based on projects.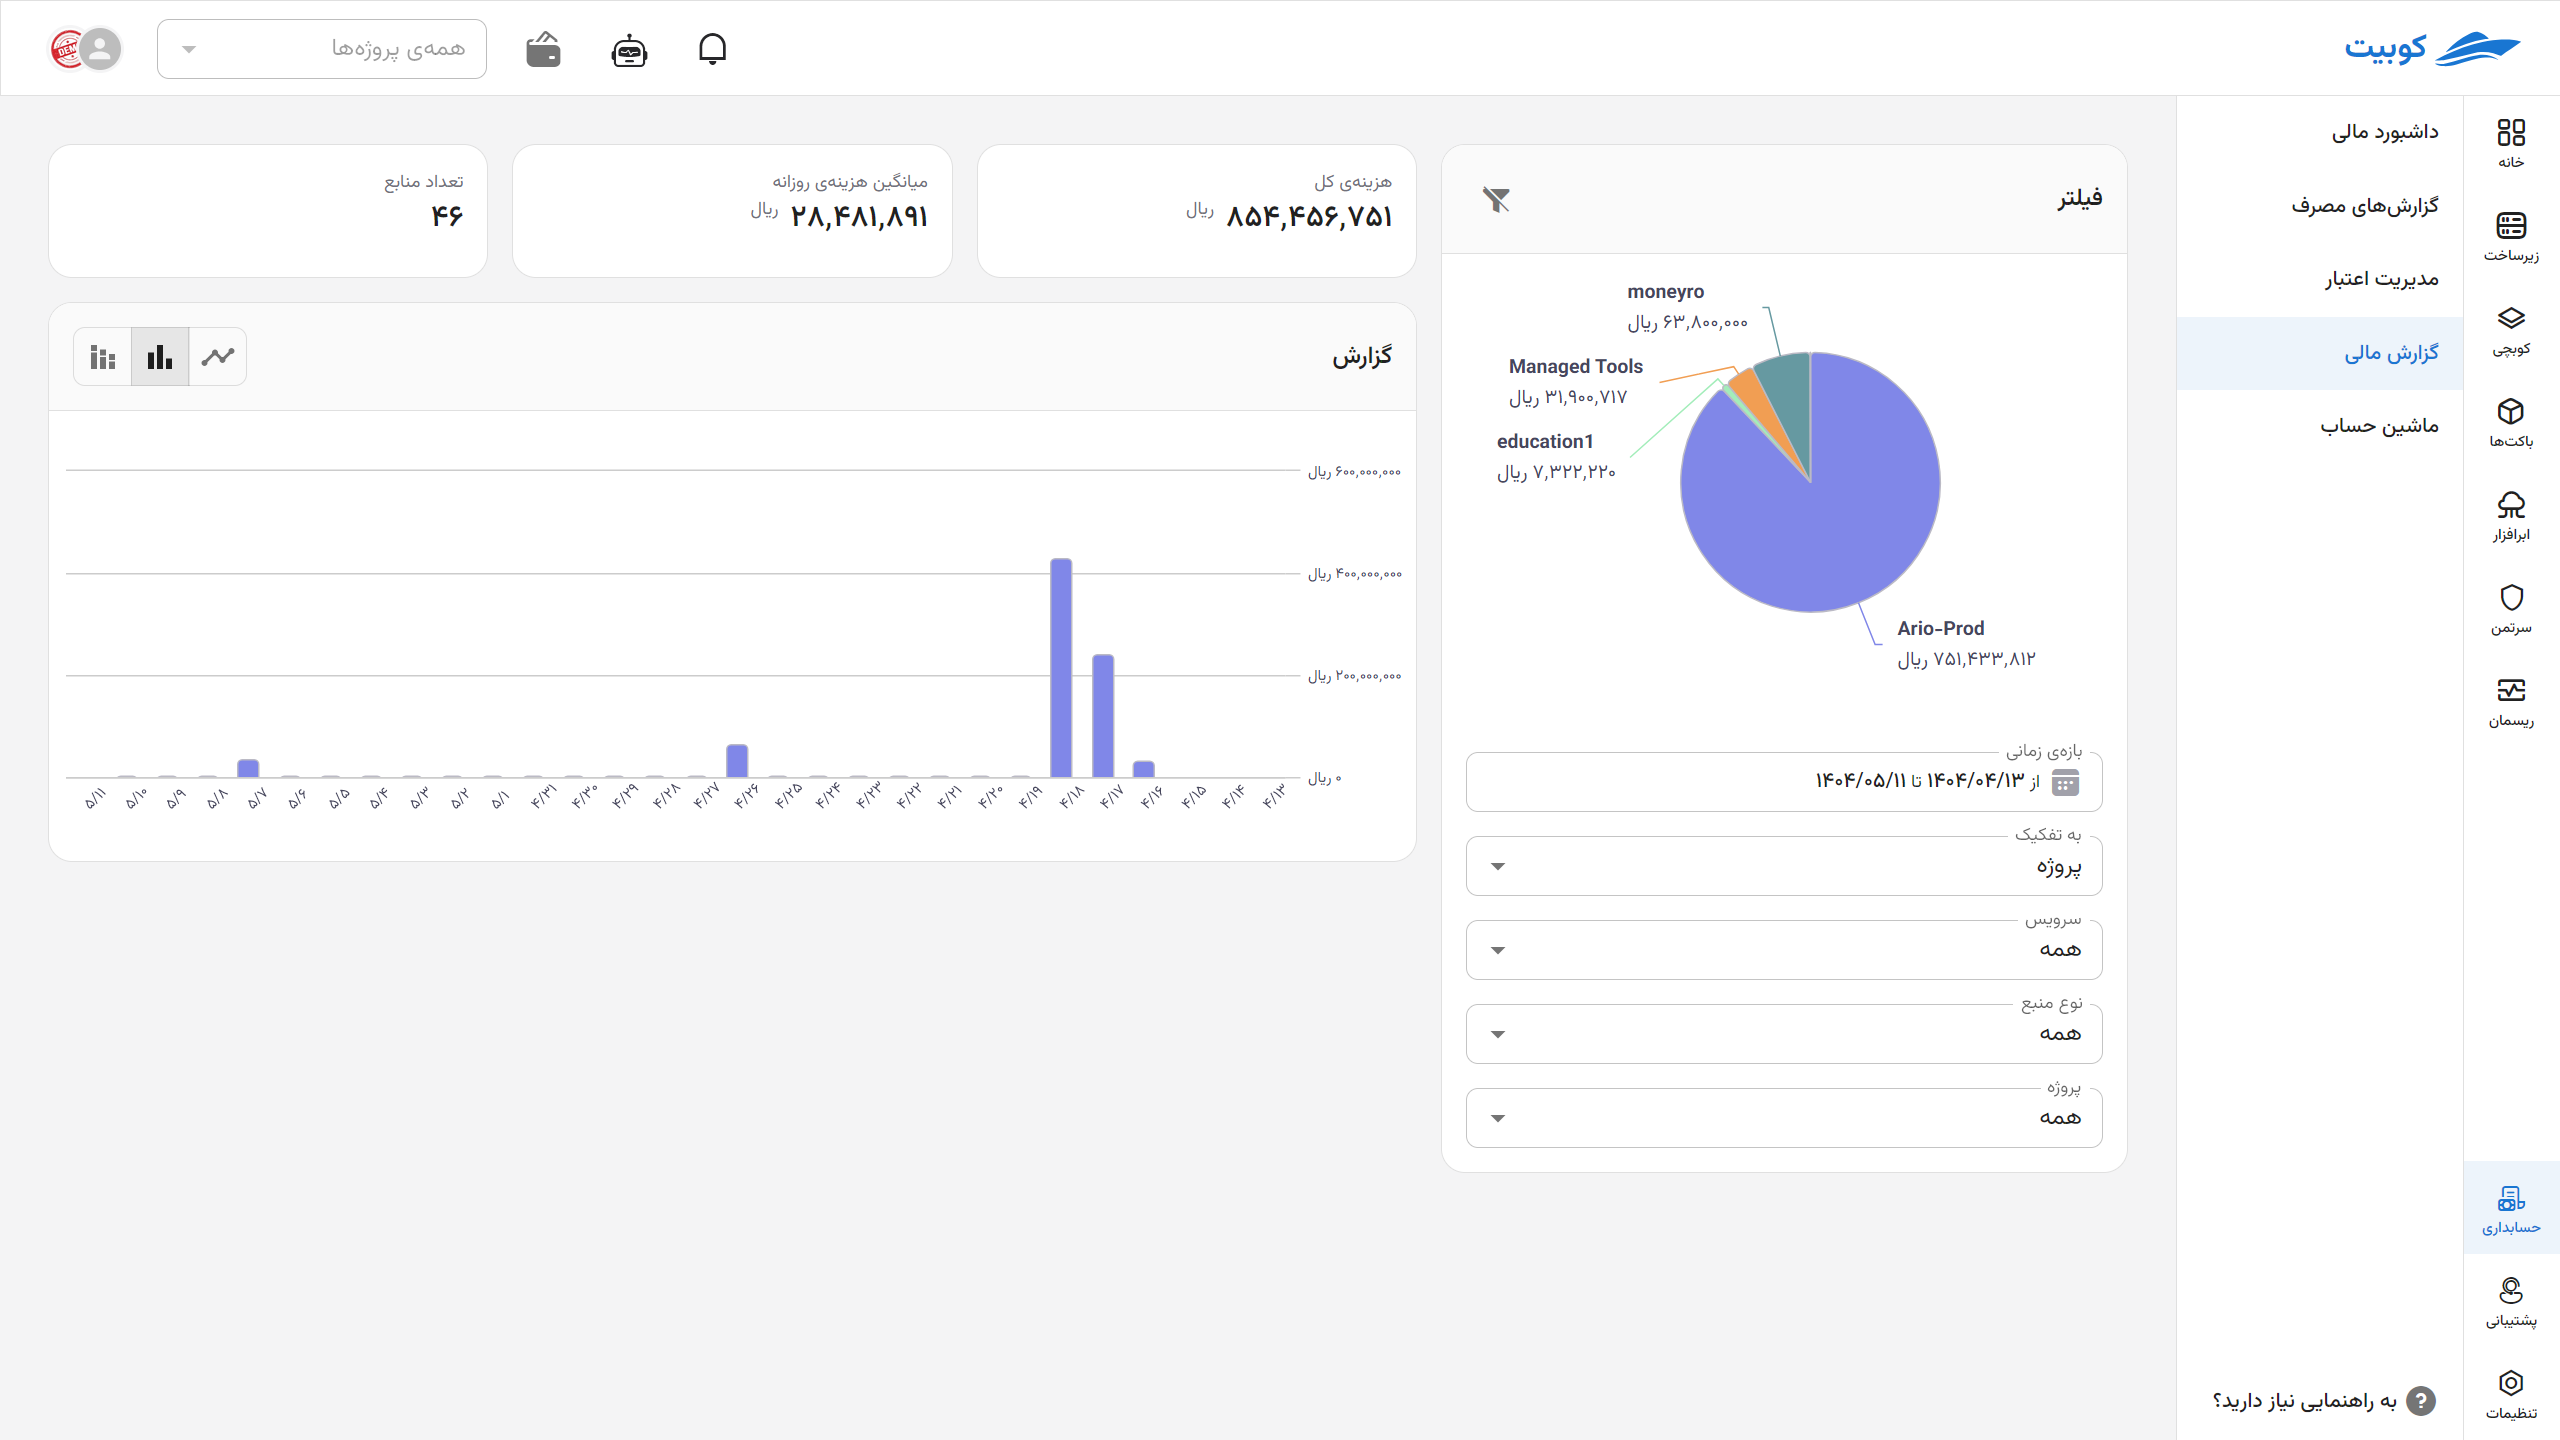
- Line Chart by Breakdown:
Presents the trend of consumption and cost changes over time in a linear format, with the option to break down by selected filters.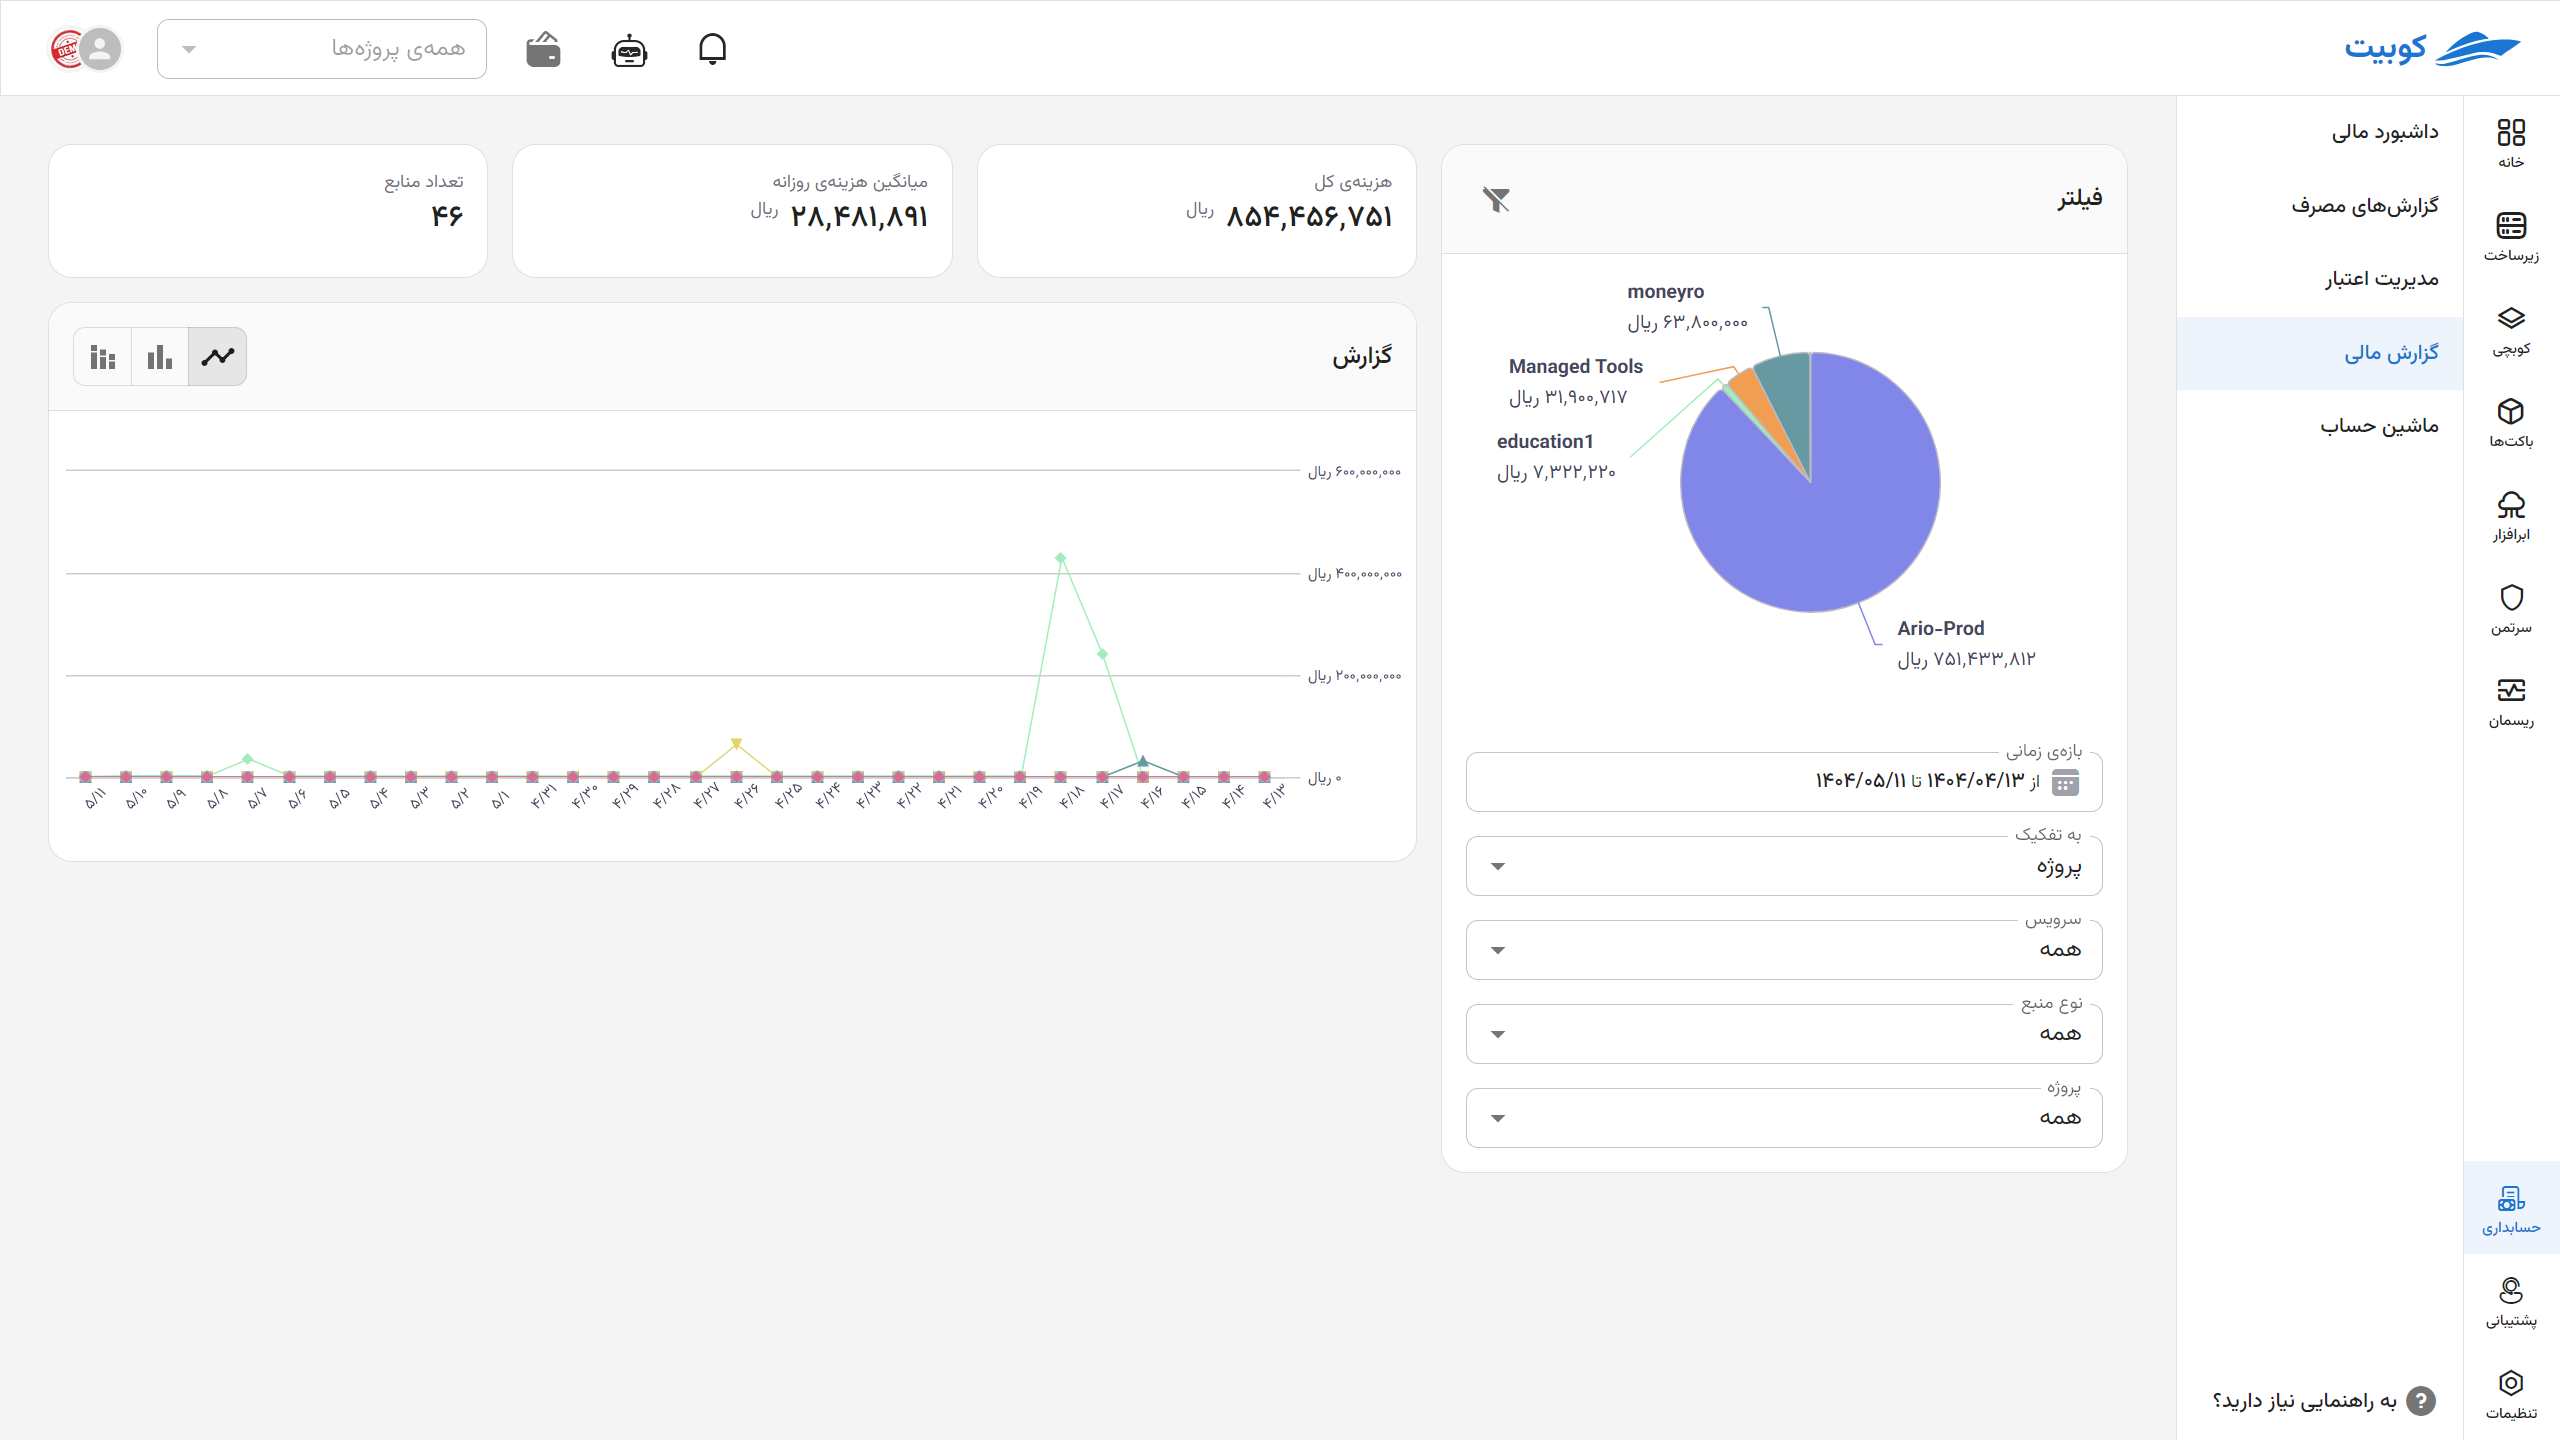
Pie Chart
- Displays the composition of consumed resources in the specified period
- Breaks down element types (e.g., VM, IP, traffic, disk volume, etc.)
- Visually represents the percentage and amount spent for each resource type