

View project and Pack alerts
Monitoring rules create alerts for conditions such as high resource usage or an unavailable part of an application. Kubchi has two views: the project view shows alerts from namespaces connected to the project, while the view inside a Pack shows only that Pack's alerts.
The Kubchi list is not an alert archive. When the monitoring system marks an alert as resolved, it disappears from the list.
Kubchi fetches the list when the page opens and does not refresh it automatically. Reload the page to see new alerts or remove an alert that has been resolved.
Prerequisites
The cluster alerting system must be active, and the application must have monitoring rules. The page and its data also depend on your role permissions.
Alert rules and labels depend on the chart and its monitoring settings, so Packs do not all produce the same alerts. An empty list alone does not prove that the application is healthy.
View project alerts
From the main Kubchi sidebar, select Alerts. This view lists alerts from namespaces connected to the current project.
Find the affected application or namespace in the project view. Then open its Pack and compare the alert with workload status and resource usage.
View Pack alerts
Open the Pack, then select Alerts from the Pack sidebar. You can also open this page from the Alerts card on the Pack Overview page.
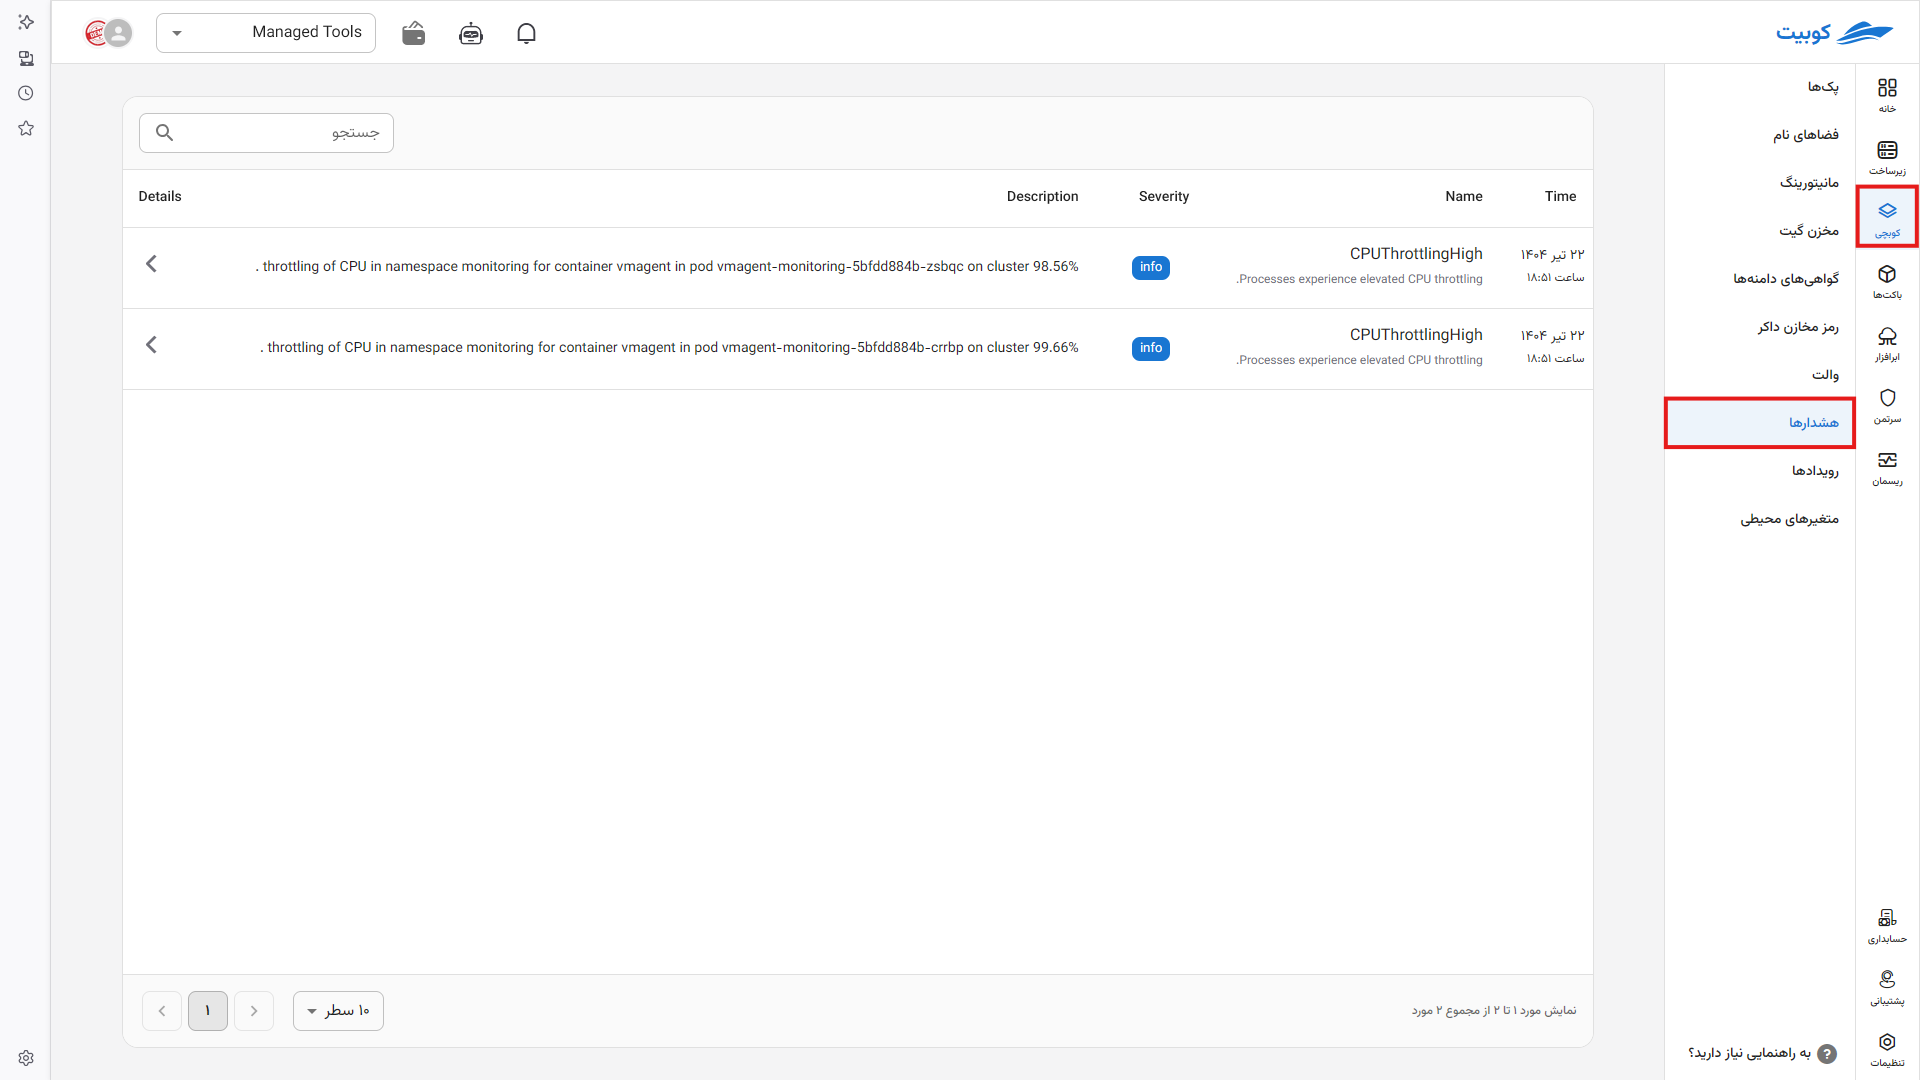
The table shows this information for each alert:
- Time: when the alert became active.
- Name: the technical alert name and a short summary.
- Severity: the severity set by the alert rule. Kubchi shows
criticalin red,warningin yellow, and other values with the information color. - Description: a description of the condition or its likely cause.
You can search the table and sort rows by time or severity.
Read alert details
Select an alert row. The Alert Details panel shows the name, start time, description, and every label received with the alert. It also shows receiver names and a dashboard link when those values are defined.
Labels identify the source and technical context of an alert. For example, they may include a namespace, release, or workload name. Read the severity, summary, and time first, then use the labels to locate the source.
The dashboard link may open another monitoring tool. Before opening it, check that the destination belongs to a domain trusted by your organization. Access to an alert in Kubchi does not guarantee access to the dashboard.
Investigate an alert
Check these pages in order:
- In Pack monitoring, inspect CPU, memory, and disk usage around the alert start time.
- On the Workloads page, check the affected workload and pods.
- Read the pod logs for the same period.
- Check Pack events for scheduling, image-pull, disk-attachment, or pod-start errors.
The Alerts page is read-only. It does not create, edit, or disable alert rules.
Common problems
The alerts list is empty
There may be no active alerts. The list can also be empty when the alerting system is inactive, no matching rule exists, or an alert is missing the labels used to associate it with the project and Pack. Check Monitoring. If that page also has no data, ask support or your infrastructure administrator to inspect the monitoring and alerting setup.
Alerts fail to load
Reload the page. If the error continues, Kubchi may be unable to reach the alerting system, or your role may not have the required permission. Send the error text, project name, and time of the failure to support or a cluster administrator.
A resolved alert is still visible
The monitoring system may need some time to evaluate the rule again and update the list. Refresh the page after a few minutes. If the alert remains, compare its description and labels with the current workload state and monitoring charts.