

Monitor project and Pack resource usage
The Monitoring section shows current and historical CPU, memory, and disk usage. The project view combines usage from namespaces connected to the project. The view inside a Pack covers only that Pack's resources.
The data comes from the cluster's metrics system and may appear with a short delay. These charts help you inspect application health and are not used to calculate costs or billing.
The current-usage cards are calculated when the page fetches data, and the charts are not live streams. A chart period ends at the beginning of the current hour, so its last point may differ from the current-usage card. Reload the page to fetch newer data.
Prerequisites
The project must be connected to a cluster with metrics collection enabled. Project monitoring requires at least one connected namespace. Pack monitoring shows data after the Pack creates a workload.
The page and its data also depend on your role permissions. An empty chart does not always mean zero usage. The metrics system may be unavailable, the workload may be new, or the selected resource may not have data yet.
View project resource usage
From the main Kubchi sidebar, select Monitoring. This view shows the combined usage of namespaces connected to the current project. It does not include resources from other projects.
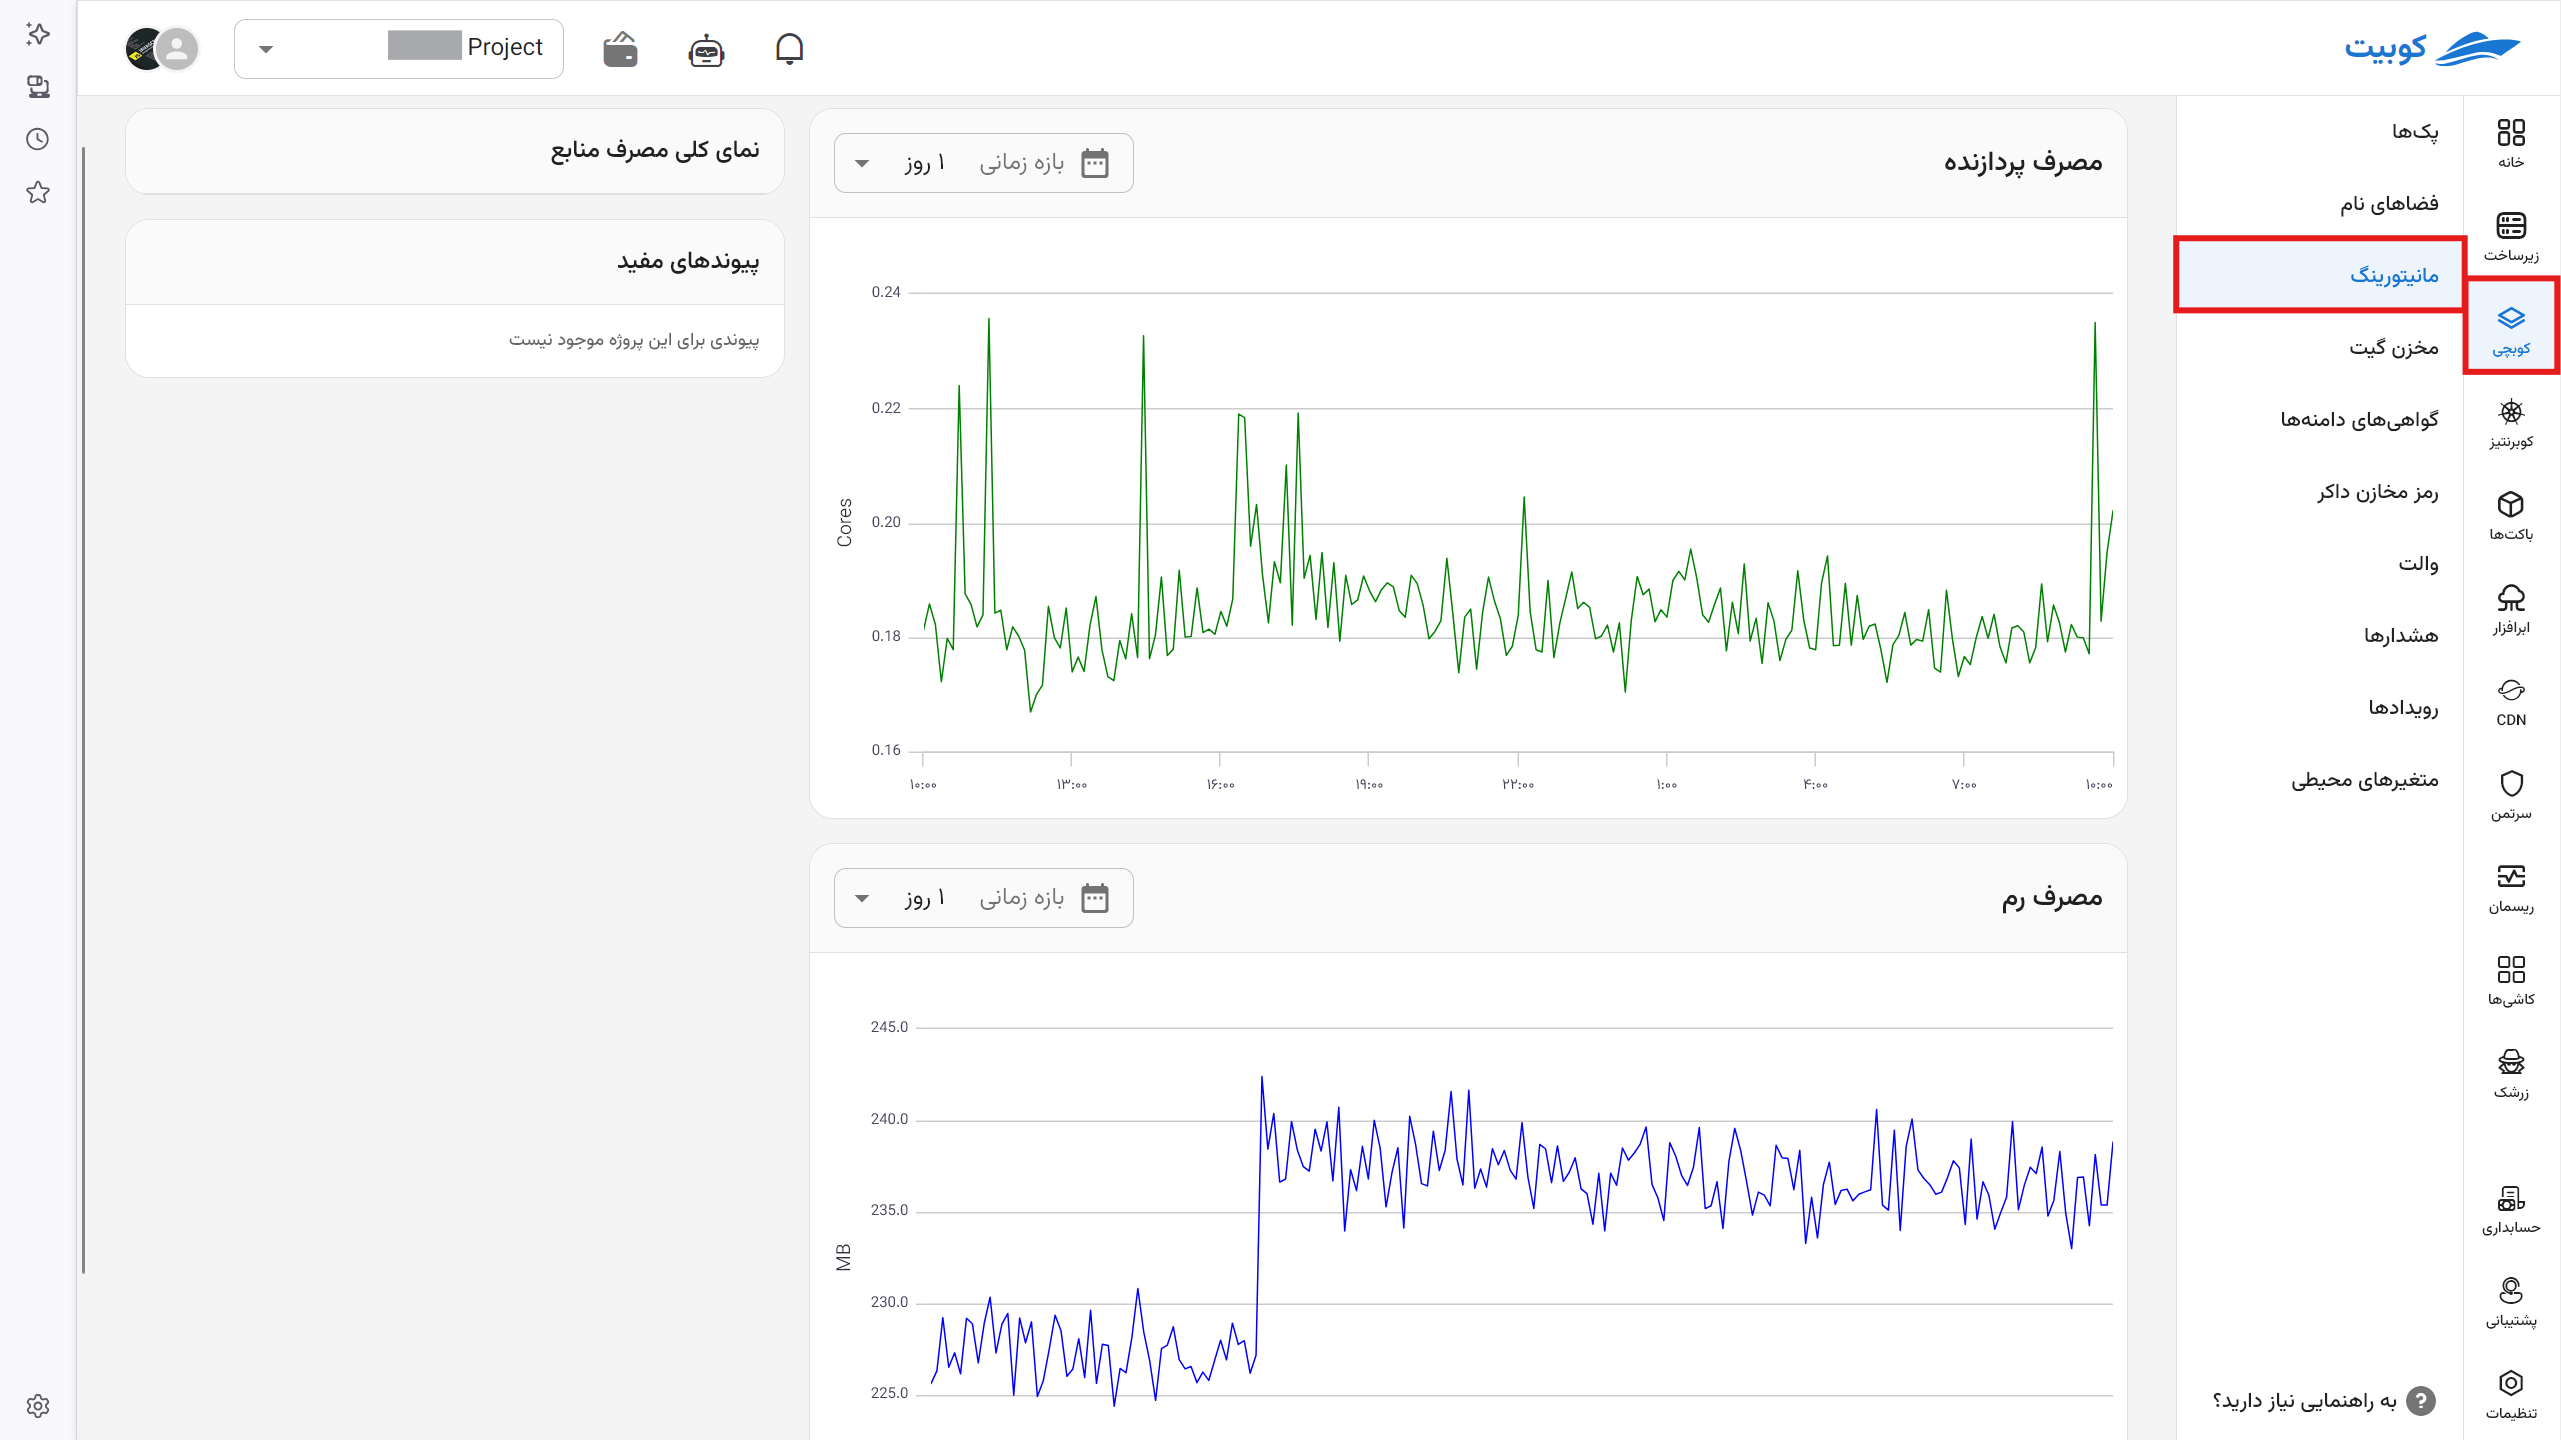
Use this view to check the overall usage trend for applications in the project. If the increase comes from one Pack, open that Pack and check its monitoring page separately.
View Pack resource usage
Open the Pack, then select Monitoring from the Pack sidebar. This view combines usage from that Pack's workloads. It does not provide a separate chart for each pod or workload.
Use the Workloads page to inspect each workload and pod. For application errors, check logs and Pack events.
Read current usage
The cards next to the charts show current resource usage:
- CPU Usage is measured in cores. A decimal value is part of one core; for example,
0.25is one quarter of a core. - Memory Usage uses a unit suitable for the value, usually
MBorGB. - Disk Usage appears only when valid metrics exist for the storage resource. Each storage resource has its own card.
For CPU and memory, each card compares usage with Request and Limit. If either value is missing, the panel shows Unlimited. Usage above the request triggers a warning; usage above the limit has a more severe state.
Project values combine resources from the connected namespaces. In Pack monitoring, usage, requests, and limits are combined across that Pack's workloads. These cards do not show one specific pod.
The disk card uses the same general layout. For disk storage, used space, usable capacity, and total capacity are the underlying values. The interface uses Request for usable capacity and Limit for total capacity.
Read historical charts
Line charts show CPU, memory, and disk usage over time. Hover over a chart to see the time and value for a point. CPU uses Cores; memory and disk use MB or GB, depending on the data size.
Each chart has its own Period selector. The current periods are:
- 3 hours
- 1 day, which is the default
- 3 days
- 1 week
- 1, 3, or 6 months
Changing the period for one chart does not change the other charts. The sampling interval grows with the selected period, so a longer period is useful for trends but contains less short-term detail.
Useful Links
The Useful Links section in Pack monitoring can contain shortcuts to dashboards for pods, workloads, or storage in tools such as Grafana. These links come from cluster settings and chart metadata, so some Packs do not have any.
Open an external link only when its domain is trusted by your organization. Access to the Kubchi monitoring page does not guarantee access to the destination dashboard.
Common problems
Charts or cards do not appear
Check that the project is connected to an active cluster and that the namespace or Pack has a running workload. The first metrics may take a few minutes to appear after installation or a restart.
A CPU or memory card may be hidden when usage is zero or no valid value is available. The disk card appears only when usage, usable capacity, and total capacity are all available. If the page remains empty despite active usage, ask support or your infrastructure administrator to check the metrics system and your role permissions.
The disk chart is missing
Disk charts appear only for storage resources with available usage and capacity data. The chart may be absent when the Pack has no PVC, usage data is unavailable, or disk metrics collection is not configured.
Request or Limit is Unlimited
The application chart has not set a request or limit for that resource, or the metrics system did not return a value. To set a persistent value, check the Pack form or configuration.
Usage increases suddenly
Select a shorter period and compare the time of the increase with restarts, configuration changes, or application events. Then check workload status, logs, and Pack alerts.